Multiple Choice
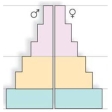
In a population with low death rates,this age structure diagram indicates that 
A) the population is decreasing.
B) the population is stable.
C) the biotic potential must be larger than usual.
D) the population will continue to grow for some time.
Correct Answer:

Verified
Correct Answer:
Verified
Q8: The population growth rate is negative when<br>A)birthrate
Q12: In the logistic growth curve formula,when N
Q15: Population size levels off at the _
Q17: When discussing population features,a cohort is described
Q29: What is the expected pattern of growth
Q31: The carrying capacity of the environment for
Q32: Bangladesh has 2,596 persons per square mile,while
Q37: Which of these diagrams represents an age
Q38: Survivorship may be defined as the probability
Q49: The maximum rate of natural increase of