Multiple Choice
Which of these diagrams represents an age structure diagram of more-developed countries? 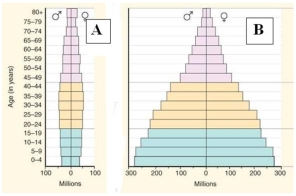
A) Diagram A
B) Diagram B
Correct Answer:

Verified
Correct Answer:
Verified
Related Questions
Q8: The population growth rate is negative when<br>A)birthrate
Q8: Consider the life of the praying mantis.The
Q12: In the logistic growth curve formula,when N
Q15: Population size levels off at the _
Q18: Which of the following circumstances would cause
Q29: What is the expected pattern of growth
Q31: The carrying capacity of the environment for
Q32: Bangladesh has 2,596 persons per square mile,while
Q35: In a population with low death rates,this
Q49: The maximum rate of natural increase of