Multiple Choice
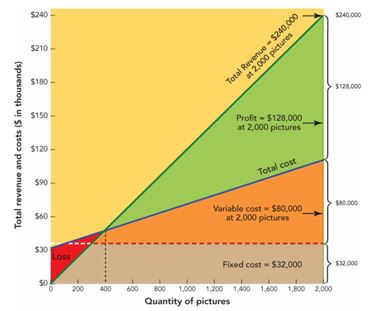
-In Figure 11-6 above, which is a break-even chart that depicts a graphic presentation of a break-even analysis for a picture frame store, the rectangular area EBCD represents the firm's
A) fixed costs.
B) break-even point.
C) variable costs.
D) profit.
E) total revenue
Correct Answer:

Verified
Correct Answer:
Verified
Q73: Which of the following statements regarding pricing
Q73: Setting a price to achieve an annual
Q128: According to Vizio,"The whole goal is to
Q130: A manufacturing company that introduces a product
Q163: Yield management is considered to be a
Q207: Setting a market price for a product
Q208: The practice of charging a very low
Q236: The practice of exchanging products and services
Q256: Which of the following is a profit-oriented
Q290: Which of the following statements about the