Multiple Choice
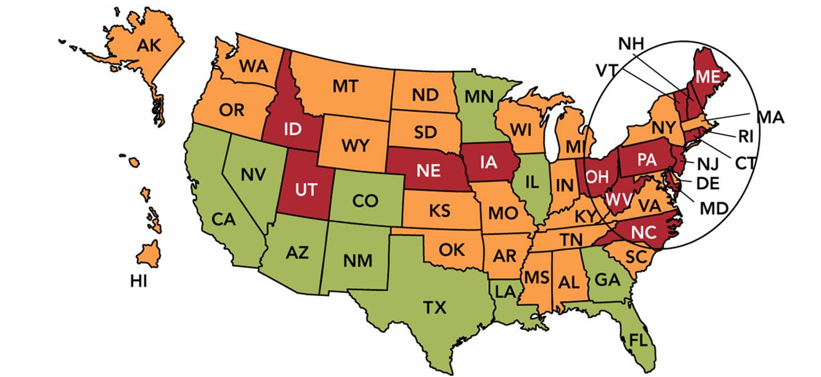
-In the UMD9: Marketing Dashboard Map above, the annual growth rate in each state is shown, with green (which looks gray on printed paper) meaning good and red (which looks black on printed paper) meaning very bad. If an organization's 2013 sales for the entire U.S. were $50 million and its 2012 U.S. sales were $30 million, what is the annual % sales change?
A) 40%
B) 67%
C) 100%
D) 125%
E) 133%
Correct Answer:

Verified
Correct Answer:
Verified
Q17: The type of good for which the
Q92: Because services tend to be a(n)_ rather
Q143: Which of the following methods is commonly
Q154: The demand for a business product that
Q156: Variations of a product (shape, configuration) within
Q194: A situation that occurs when a service
Q194: Many restaurants now ask consumers to evaluate
Q196: The Apple II, Macintosh, iPod, iPhone, iPad,
Q203: Newman's Own is a company that gives
Q269: What categories of products are classified as