Multiple Choice
Use the following graph to answer the following questions.
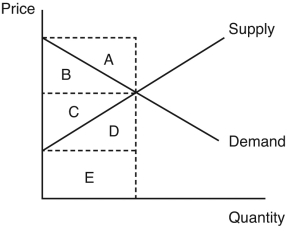
-In the figure,which region represents the consumer surplus?
A) area A
B) area B
C) area C
D) area D
E) area E
Correct Answer:

Verified
Correct Answer:
Verified
Related Questions
Q84: The net cost to society from the
Q85: When demand is perfectly elastic,the demand curve
Q86: For a given good,a seller's willingness to
Q87: When looking at a graph,the area under
Q88: Excise taxes are taxes that are<br>A) applied
Q90: A tax that is applied to one
Q91: Use the following information to answer the
Q92: Another name for a consumer's willingness to
Q93: The elasticities of supply and demand are
Q94: Draw a set of supply and demand