Multiple Choice
Use the following information to answer the following questions.
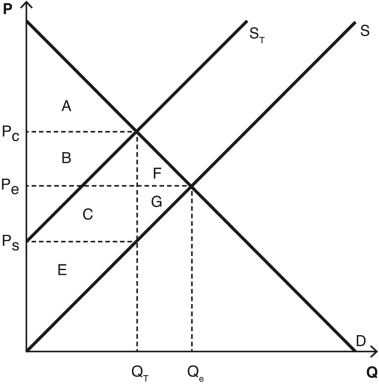
The following graph depicts a market where a tax has been imposed.Pe was the equilibrium price before the tax was imposed,and Qe was the equilibrium quantity.After the tax,PC is the price that consumers pay,and PS is the price that producers receive.QT units are sold after the tax is imposed.NOTE: The areas B and C are rectangles that are divided by the supply curve ST.Include both sections of those rectangles when choosing your answers.

-What is the total amount of producer and consumer surplus (i.e. ,social welfare) in this market after the tax is imposed?
A) A + B + C + E + F + G
B) A + E
C) A + B + C + E
D) F + G
E) B + C + F + G
Correct Answer:

Verified
Correct Answer:
Verified
Q86: For a given good,a seller's willingness to
Q87: When looking at a graph,the area under
Q88: Excise taxes are taxes that are<br>A) applied
Q89: Use the following graph to answer the
Q90: A tax that is applied to one
Q92: Another name for a consumer's willingness to
Q93: The elasticities of supply and demand are
Q94: Draw a set of supply and demand
Q95: All taxes create some deadweight loss,unless<br>A) the
Q96: When the price of a good increases