Multiple Choice
Use the following graph to answer the following questions.
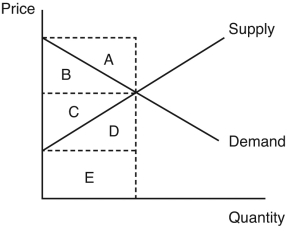
-In the figure,which combination of areas represents the social welfare?
A) A + D
B) B + C
C) D + E
D) A + B
E) C + D
Correct Answer:

Verified
Correct Answer:
Verified
Related Questions
Q133: Questions about the equity of a tax
Q134: Use the following information to answer the
Q135: A market has reached an efficient outcome
Q136: Consider the market for socks.The current price
Q137: A good with a _ supply generates
Q139: The benefit to society from the imposition
Q140: If a tax is imposed on a
Q141: When a tax is imposed,consumer surplus and
Q142: A tax on milk would likely cause
Q143: Which of the following statements is concerned