Multiple Choice
Use the following information to answer the following questions.
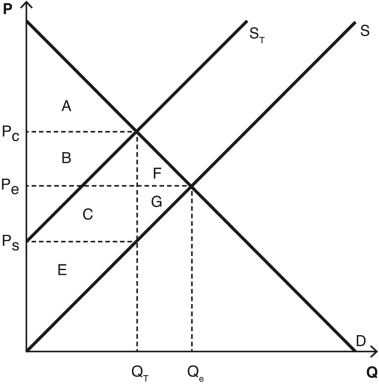
The following graph depicts a market where a tax has been imposed.Pe was the equilibrium price before the tax was imposed,and Qe was the equilibrium quantity.After the tax,PC is the price that consumers pay,and PS is the price that producers receive.QT units are sold after the tax is imposed.NOTE: The areas B and C are rectangles that are divided by the supply curve ST.Include both sections of those rectangles when choosing your answers.

-Which areas represent the total lost consumer and producer surplus (i.e. ,social welfare) as a result of the tax?
A) A + B + C + E + F + G
B) A + C
C) A + B + C + E
D) F + G
E) B + C + F + G
Correct Answer:

Verified
Correct Answer:
Verified
Q129: An excise tax will always cause
Q130: Use the following information to answer the
Q131: LDT Products,Inc. ,designs and sells flannel jackets.The
Q132: "For any good,the consumer surplus should be
Q133: Questions about the equity of a tax
Q135: A market has reached an efficient outcome
Q136: Consider the market for socks.The current price
Q137: A good with a _ supply generates
Q138: Use the following graph to answer the
Q139: The benefit to society from the imposition