Multiple Choice
A company has the information shown in the chart below regarding its forecast performance in the past three periods. 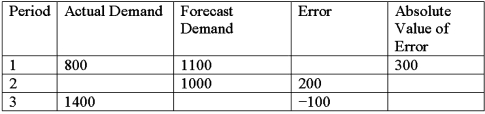 What is the mean absolute deviation (MAD) ?
A) 200
B) 225
C) -66.67
D) 1200
Correct Answer:

Verified
Correct Answer:
Verified
Related Questions
Q20: Designing postponable products has the potential to
Q21: Use the data below. <img src="https://d2lvgg3v3hfg70.cloudfront.net/TB6018/.jpg" alt="Use
Q22: The tracking signal will suggest to a
Q24: For Platinum Nugget Hotel in Las Vegas,
Q26: Assume that the forecast for the last
Q27: A company has the data shown in
Q28: Over a six-month period, the demand for
Q29: Refer to the data below for Zanda
Q30: Assume that the forecast for the last
Q43: The primary difference between demand management and