Multiple Choice
A company has the data shown in the chart below concerning its forecast performance over the past four time periods. 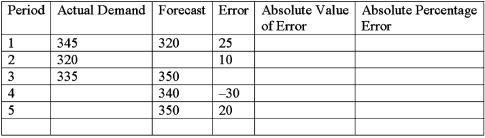 Complete the chart and compute the MAD.
A) 2
B) 20
C) 10
D) 100
Correct Answer:

Verified
Correct Answer:
Verified
Related Questions
Q3: Zanda Corp.has been testing the performance of
Q22: The tracking signal will suggest to a
Q24: For Platinum Nugget Hotel in Las Vegas,
Q25: A company has the information shown in
Q26: Assume that the forecast for the last
Q26: A forecasting technique that seeks inputs from
Q28: Over a six-month period, the demand for
Q29: Refer to the data below for Zanda
Q30: Assume that the forecast for the last
Q43: The primary difference between demand management and