Multiple Choice
The following diagram represents the reaction of A2 (unshaded spheres) with B (shaded spheres) .How many moles of product can be produced from the reaction of 1.0 mol of A2 and 1.0 mol of B? 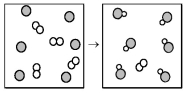
A) 0) 5 mol of product
B) 1) 0 mol of product
C) 3) 0 mol of product
D) 6) 0 mol of product
Correct Answer:

Verified
Correct Answer:
Verified
Related Questions
Q32: How many moles are there in 3.00
Q56: What is the identity of substance X
Q89: How many mL of a 0.175 M
Q91: What is the balanced chemical equation for
Q94: 7.0 g of nitrogen is reacted with
Q95: Calcium phosphate reacts with sulfuric acid to
Q96: If the reaction of phosphate ion with
Q97: When a 1.0 M solution of NaCl
Q107: When the reaction C<sub>4</sub>H<sub>10</sub> + O<sub>2</sub> →
Q144: Given the chemical equation: N<sub>2</sub> + 3