menu-iconExamlexExamLexServices

Discover

Ask a Question
  1. All Topics
  2. Topic
    Chemistry
  3. Study Set
    Chemistry Study Set 1
  4. Exam
    Exam 15: Applications of Aqueous Equilibria
  5. Question
    The Following Plot Shows a Titration Curve for the Titration
Solved

The Following Plot Shows a Titration Curve for the Titration

Question 134

Question 134

Multiple Choice

The following plot shows a titration curve for the titration of 1.00 L of 1.00 M diprotic acid H2A+ with NaOH.Which point a-d represents the isoelectric point?
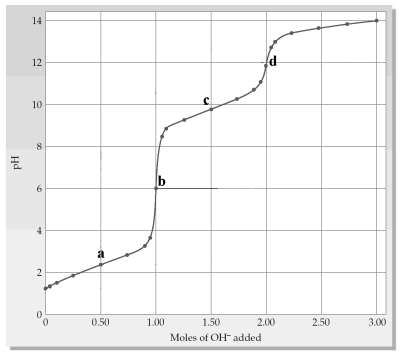
 The following plot shows a titration curve for the titration of 1.00 L of 1.00 M diprotic acid H<sub>2</sub>A<sup>+</sup> with NaOH.Which point a-d represents the isoelectric point?   A) point a B) point b C) point c D) point d


A) point a
B) point b
C) point c
D) point d

Correct Answer:

verifed

Verified

Unlock this answer now
Get Access to more Verified Answers free of charge

Related Questions

Q5: What is the pH of a buffer

Q111: Which of the following reactions are not

Q130: What is the molar solubility of CaF<sub>2</sub>

Q131: What is the approximate value of the

Q132: When 50 mL of 0.10 M NH<sub>4</sub>Cl

Q133: What is the equilibrium constant expression for

Q135: What is the chromium ion concentration for

Q136: When equal molar amounts of the following

Q137: What is the [CH<sub>3</sub>CO<sub>2</sub>-]/[CH<sub>3</sub>CO<sub>2</sub>H] ratio necessary to

Q139: What is the most soluble salt of

Examlex

ExamLex

About UsContact UsPerks CenterHomeschoolingTest Prep

Work With Us

Campus RepresentativeInfluencers

Links

FaqPricingChrome Extension

Download The App

Get App StoreGet Google Play

Policies

Privacy PolicyTerms of ServiceHonor CodeCommunity Guidelines

Scan To Download

qr-code

Copyright © (2025) ExamLex LLC.

Privacy PolicyTerms Of ServiceHonor CodeCommunity Guidelines