Multiple Choice
Figure 36-1.The left-hand graph shows a short-run aggregate-supply (SRAS) curve and two aggregate-demand (AD) curves.On the right-hand diagram,U represents the unemployment rate. 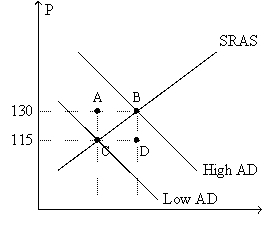
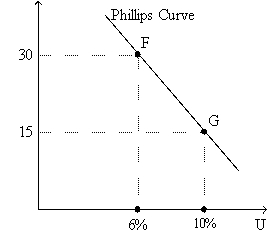
-Refer to Figure 36-1.The curve that is depicted on the right-hand graph offers policymakers a "menu" of combinations
A) that applies both in the short run and in the long run.
B) that is relevant to choices involving fiscal policy,but not to choices involving monetary policy.
C) of inflation and unemployment.
D) All of the above are correct.
Correct Answer:

Verified
Correct Answer:
Verified
Q8: If monetary policy moves unemployment below its
Q10: In the long run,<br>A)the natural rate of
Q13: A shock increases the costs of production.Given
Q22: The logic behind the tradeoff between inflation
Q35: Figure 36-7<br>Use this graph to answer the
Q35: The sacrifice ratio is the<br>A)sum of the
Q36: Figure 36-8.The left-hand graph shows a short-run
Q36: If the short-run Phillips curve were stable,which
Q44: Which of the following leads to a
Q65: If a central bank reduces inflation 2