Multiple Choice
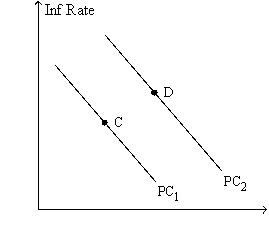
Figure 36-8.The left-hand graph shows a short-run aggregate-supply (SRAS) curve and two aggregate-demand (AD) curves.On the right-hand diagram,"Inf Rate" means "Inflation Rate." 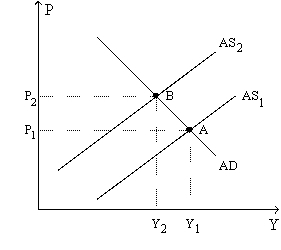
-Refer to Figure 36-8.The shift of the aggregate-supply curve from AS1 to AS2
A) results in a more favorable trade-off between inflation and unemployment.
B) results in a more favorable trade-off between inflation and the growth rate of real GDP.
C) represents an adverse shock to aggregate supply.
D) represents a favorable shock to aggregate supply.
Correct Answer:

Verified
Correct Answer:
Verified
Q10: In the long run,<br>A)the natural rate of
Q12: In response to the financial crisis of
Q13: A shock increases the costs of production.Given
Q34: Figure 36-1.The left-hand graph shows a short-run
Q35: Figure 36-7<br>Use this graph to answer the
Q35: The sacrifice ratio is the<br>A)sum of the
Q36: If the short-run Phillips curve were stable,which
Q44: Which of the following leads to a
Q65: If a central bank reduces inflation 2
Q187: A basis for the slope of the