Essay
Based on the means in the following table: 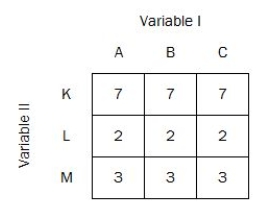 a.Make a graph.
b.Figure marginal means.
c.Assuming all numerical differences are statistically significant,identify which effects are significant and which effects are not significant.
Correct Answer:

Verified
A = 4,B = 4,C = 4; Row margina...View Answer
Unlock this answer now
Get Access to more Verified Answers free of charge
Correct Answer:
Verified
View Answer
Unlock this answer now
Get Access to more Verified Answers free of charge
Q60: In a 2 × 3 × 3
Q61: In a 3 × 3 analysis of
Q62: In a factorial design,a "cell" is<br>A)each combination
Q63: In a 2 × 2 analysis of
Q64: The controversial process of using the mean
Q65: An interaction effect can be identified by<br>A)looking
Q66: In a 2 × 2 analysis of
Q67: For a factorial analysis of variance,the assumptions
Q68: What is the relationship between the amount
Q69: Advanced topic: N<sub>Cells</sub> - df<sub>Columns</sub> - df<sub>Rows</sub>