Multiple Choice
Figuer:
The insets below show the age structures of India, the United States, and China. 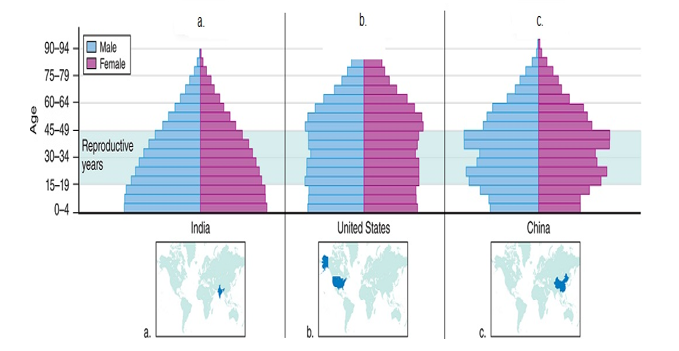
-A population age structure diagram showing roughly equal numbers in each age group,such as shown above in inset b for the United States,depicts a
A) declining population.
B) stable population.
C) very small population size.
D) population facing extinction.
E) growing population.
Correct Answer:

Verified
Correct Answer:
Verified
Q41: What key conclusion did Riesch and Schlupp
Q42: Which of the following best describes the
Q43: In a population growth curve that is
Q44: The maximum number of individuals that a
Q45: An example of a density-independent factor that
Q47: The combination of external factors that keep
Q48: Emigration is the migration out of a
Q49: Graphed from 10,000 BCE to 2010,as shown
Q50: When logistic growth is plotted over time,a
Q51: Figuer:<br>Three population distribution patterns are shown in