Multiple Choice
Graphed from 10,000 BCE to 2010,as shown below,the global human population 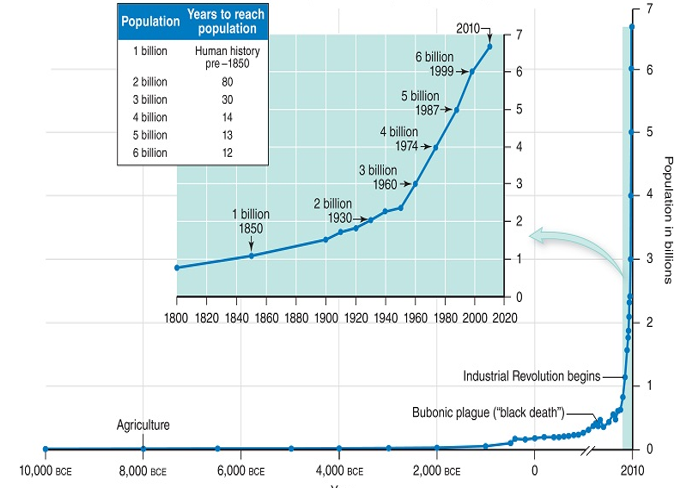
A) has reached 0% growth rate, as shown by the data plot at 2010.
B) shows the typical curve of logistic growth.
C) is showing clearly that humans are at Earth's carrying capacity for our species.
D) None of the answer choices are correct.
E) shows the typical curve of exponential growth.
Correct Answer:

Verified
Correct Answer:
Verified
Q44: The maximum number of individuals that a
Q45: An example of a density-independent factor that
Q46: Figuer:<br>The insets below show the age structures
Q47: The combination of external factors that keep
Q48: Emigration is the migration out of a
Q50: When logistic growth is plotted over time,a
Q51: Figuer:<br>Three population distribution patterns are shown in
Q52: If a deer herd has a population
Q53: In a survivorship curve,a type I species,like
Q54: In 2010 India had a population of