Multiple Choice
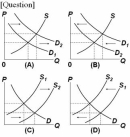 Which of the above diagrams illustrate(s) the effect of a decrease in incomes on the market for secondhand clothing?
A) A and C
B) A only
C) B only
D) C only
Correct Answer:

Verified
Correct Answer:
Verified
Related Questions
Q46: A price ceiling set by government will
Q49: A shift to the right in the
Q50: If consumers are willing to pay a
Q51: Which of the following will cause the
Q53: <img src="https://d2lvgg3v3hfg70.cloudfront.net/TB4893/.jpg" alt=" Which of the
Q80: A price floor in a competitive market
Q108: In the following question you are asked
Q117: The rationing function of prices refers to
Q131: An effective price ceiling will<br>A) induce new
Q166: An effective price floor will<br>A) force some