Multiple Choice
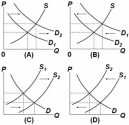 Which of the above diagrams illustrate(s) the effect of a decline in the price of irrigation equipment on the market for corn?
A) B only
B) C only
C) B and C
D) D only
Correct Answer:

Verified
Correct Answer:
Verified
Related Questions
Q6: In a competitive market, every consumer willing
Q48: <img src="https://d2lvgg3v3hfg70.cloudfront.net/TB4893/.jpg" alt=" Which of the
Q49: A shift to the right in the
Q50: If consumers are willing to pay a
Q51: Which of the following will cause the
Q57: <img src="https://d2lvgg3v3hfg70.cloudfront.net/TB4893/.jpg" alt=" Refer to the
Q58: In the following question you are asked
Q80: A price floor in a competitive market
Q219: Increasing marginal cost of production explains<br>A) the
Q273: Over time, the equilibrium price of a