Multiple Choice
The following graph shows the average and marginal revenue curves for a monopolist:
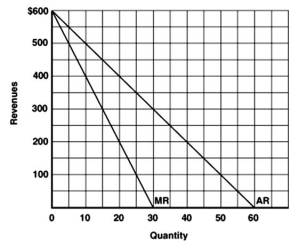
-Refer to the graph above to answer this question.At what output is total revenue maximized?
A) 30.
B) 40.
C) 50.
D) 60.
Correct Answer:

Verified
Correct Answer:
Verified
Related Questions
Q156: The following table shows the demand facing
Q157: The following graph depicts the costs and
Q158: Table 10.3 shows the demand and total
Q159: Which of the following markets most closely
Q160: The following table gives the cost and
Q162: A monopolist will only be able to
Q163: The market imperfection brought about by monopoly
Q164: Which of the following is an example
Q165: Which of the following is a correct
Q166: A patent is an example of a