Multiple Choice
The following graph depicts the costs and revenues for an unregulated monopolist:
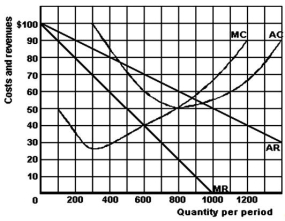
-Refer to the graph above to answer this question.What is the monopolist's maximum total revenue?
A) $600.
B) $40,000.
C) $42,000.
D) $48,000.
E) $50,000.
Correct Answer:

Verified
Correct Answer:
Verified
Related Questions
Q152: Which of the following is true?<br>A)A monopolist
Q153: Suppose that a perfectly competitive industry is
Q154: Which of the following statements regarding the
Q155: The following graph gives cost and revenue
Q156: The following table shows the demand facing
Q158: Table 10.3 shows the demand and total
Q159: Which of the following markets most closely
Q160: The following table gives the cost and
Q161: The following graph shows the average and
Q162: A monopolist will only be able to