Multiple Choice
The following graph gives cost and revenue data for a monopolist:
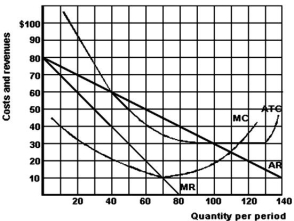
-Refer to the above graph to answer this question.If the monopolist is unregulated,what is the level of maximum profits?
A) $0.
B) $10.
C) $450.
D) $700.
E) $2,450.
Correct Answer:

Verified
Correct Answer:
Verified
Q50: <img src="https://d2lvgg3v3hfg70.cloudfront.net/TB5692/.jpg" alt=" -Refer to the
Q51: The following graph gives cost and revenue
Q52: The following graph gives cost and revenue
Q53: Who is a natural monopolist?<br>A)A single producer
Q54: What are the main features of a
Q56: If a monopolist set the quantity produced
Q57: "In a monopoly,there is only one seller,therefore
Q58: The following graph depicts the costs and
Q59: <img src="https://d2lvgg3v3hfg70.cloudfront.net/TB5692/.jpg" alt=" -Refer to the
Q60: The following table gives the cost and