Multiple Choice
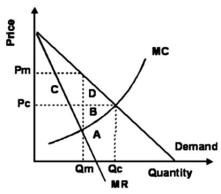
-Refer to the graph above.Area B represents:
A) the loss of surplus by consumers resulting from a monopoly.
B) the cost to society of increasing output from Qm to Qc.
C) consumer surplus redistributed to the monopolist.
D) the loss of surplus by producers resulting from a monopoly.
Correct Answer:

Verified
Correct Answer:
Verified
Q54: What are the main features of a
Q55: The following graph gives cost and revenue
Q56: If a monopolist set the quantity produced
Q57: "In a monopoly,there is only one seller,therefore
Q58: The following graph depicts the costs and
Q60: The following table gives the cost and
Q61: The following data relates to an unregulated
Q62: The following table shows the demand facing
Q63: How do a monopoly lump-sum profits tax
Q64: All of the following,except one,are true statements