Multiple Choice
Figure 10.10 depicts the cost and revenue curves for a monopolist.
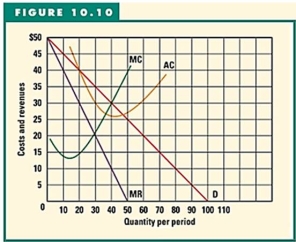
-Refer to Figure 10.10 to answer this question.What are the profit-maximizing level of output and price respectively?
A) 30 and $20.
B) 30 and $35.
C) 35 and $27.50.
D) 40 and $30.
E) 42 and $28.
Correct Answer:

Verified
Correct Answer:
Verified
Q93: What is meant by the term natural
Q94: Suppose a monopolist can divide its market
Q95: The following table gives the cost and
Q96: <img src="https://d2lvgg3v3hfg70.cloudfront.net/TB5692/.jpg" alt=" -Refer to the
Q97: The following table gives the cost and
Q99: Suppose a monopolist was charging a price
Q100: Table 10.4 outlines the cost and revenue
Q101: The following graph depicts the costs and
Q102: A natural monopoly exists when a single
Q103: Figure 10.10 depicts the cost and revenue