Multiple Choice
Figure 10.10 depicts the cost and revenue curves for a monopolist.
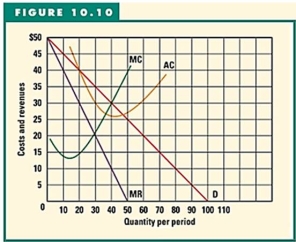
-Refer to Figure 10.10 to answer this question.At the profit-maximizing level of output,what is the amount of total costs?
A) $20.
B) $600.
C) $900.
D) $1,200.
E) Cannot be determined from this information.
Correct Answer:

Verified
Correct Answer:
Verified
Related Questions
Q98: Figure 10.10 depicts the cost and revenue
Q99: Suppose a monopolist was charging a price
Q100: Table 10.4 outlines the cost and revenue
Q101: The following graph depicts the costs and
Q102: A natural monopoly exists when a single
Q104: The following data refers to an unregulated
Q105: All of the following except one are
Q106: What is the name for a market
Q107: A lump-sum profit tax imposed on a
Q108: Table 10.5,which is data for a monopolist.<br>