Essay
The table below contains short run average cost data for five different plant sizes for C3PO Technologies Ltd.

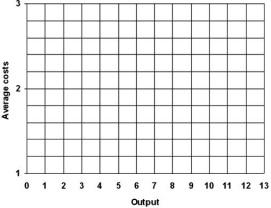
a)On the grid in the figure below,graph the short-run average cost curves for the five plants. 
b)What is the right-size of plant for each of the following output levels:2,4,6,8 and 10?
c)Do a sketch of the long-run average cost curve in the graph above.
d)What plant size would C3PO need to use in order to achieve MES?
e)If C3PO is producing an output level of 6 in plant size 4,does excess capacity exist?
Correct Answer:

Verified
a)See figure below: ...View Answer
Unlock this answer now
Get Access to more Verified Answers free of charge
Correct Answer:
Verified
View Answer
Unlock this answer now
Get Access to more Verified Answers free of charge
Q6: <img src="https://d2lvgg3v3hfg70.cloudfront.net/TB5692/.jpg" alt=" -Refer to the
Q7: The figure below illustrates a series of
Q8: Which of the following statements is correct
Q9: What is the likely cause of a
Q10: What does the term "minimum efficient scale"
Q12: Adam Smith observed that the division of
Q13: The fact that a one-minute television commercial
Q14: Suppose that a firm's total cost of
Q15: All of the following statements except one
Q16: In the graph below six short-run average