Essay
The figure below illustrates a series of short-run cost curves numbered AC1 through AC4,which correspond to the only four different plant sizes possible.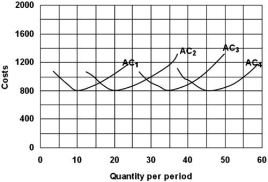
a)What can you say about returns to scale?
b)Are economies of scale present?
c)If it takes 6 workers and 30 units of capital to produce 10 units of output,how much labour and capital are necessary to produce 20 units of output?
Correct Answer:

Verified
a)Constant returns t...View Answer
Unlock this answer now
Get Access to more Verified Answers free of charge
Correct Answer:
Verified
View Answer
Unlock this answer now
Get Access to more Verified Answers free of charge
Q2: The long-run average cost curve declines continuously
Q3: The graph below includes two plant sizes
Q4: The long run is the circumstance in
Q5: What is meant by the term economic
Q6: <img src="https://d2lvgg3v3hfg70.cloudfront.net/TB5692/.jpg" alt=" -Refer to the
Q8: Which of the following statements is correct
Q9: What is the likely cause of a
Q10: What does the term "minimum efficient scale"
Q11: The table below contains short run average
Q12: Adam Smith observed that the division of