Multiple Choice
The display shows the heights of Grade 12 students at a local high school,collected so that the students could be arranged with shorter ones in front and taller ones in back for a class photograph.In addition to describing the distribution,give a reason to account for the shape of this distribution. 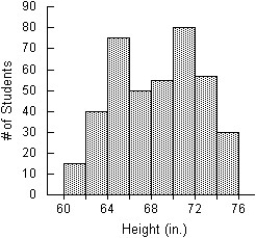
A) The distribution of the heights of Grade 12 students is bimodal,with a mode at around 65 inches and the other mode around 71 inches.The students' heights are between 60 inches and 74 inches.The two modes would likely represent the average heights of the male and female students.
B) The distribution of the heights of Grade 12 students is unimodal centred at 68,with a heights ranging from 60 inches to 76 inches.The two peaks would likely represent the average heights of the male and female students.
C) The distribution of the heights of Grade 12 students is bimodal,with a mode at around 62 inches and the other mode around 74 inches.No student has a height below 60 inches or above 76 inches.The two modes would likely represent the average heights of the male and female students.
D) The distribution of the heights of Grade 12 students is bimodal,with a mode at around 65 inches and the other mode around 71 inches.No student has a height below 60 inches or above 76 inches.The two modes would likely represent the average heights of the male and female students.
E) The distribution of the heights of Grade 12 students is uniform centred at 68,with a heights ranging from 60 inches to 76 inches.The two peaks would likely represent the average heights of the male and female students.
Correct Answer:

Verified
Correct Answer:
Verified
Q17: Which class had the largest standard deviation?<br>A)Class
Q80: The weekly salaries,in dollars,of 16 government workers
Q81: Which set has the largest standard deviation?
Q82: Three statistics classes (50 students each)took the
Q84: In May 2011,17 coffee shops in Toronto
Q86: The weekly salaries,in dollars,of 16 government workers
Q87: The weights,in kilograms,of 18 randomly selected adults
Q88: The data below represent the midterm grades
Q90: The ages of the 21 members of
Q124: A small company employs a supervisor at