Essay
The data below represent the midterm grades for 24 students enrolled in an electrical engineering course.Create a stem-and-leaf display of the data.Use split stems.Let the lower leaf represent digits 0-4 and the upper leaf represent 5-9. 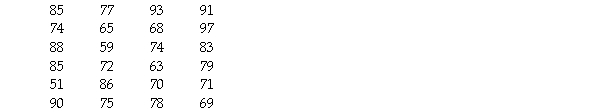
Correct Answer:

Verified
 _TB3448_00...
View Answer
Unlock this answer now
Get Access to more Verified Answers free of charge
Correct Answer:
Verified
View Answer
Unlock this answer now
Get Access to more Verified Answers free of charge
Q17: Which class had the largest standard deviation?<br>A)Class
Q84: In May 2011,17 coffee shops in Toronto
Q85: The display shows the heights of Grade
Q86: The weekly salaries,in dollars,of 16 government workers
Q87: The weights,in kilograms,of 18 randomly selected adults
Q90: The ages of the 21 members of
Q91: The annual incomes,in dollars,of several doctors are
Q92: Members of the Ontario Field Ornithologists (OFO)observe
Q93: The students in a math class took
Q124: A small company employs a supervisor at