Multiple Choice
A student at a local university took a total of 20 exams during freshman year.The student recorded the exam scores as percentages and created the following stem-and-leaf display.The lower stem contains leaves with the digits 0-4 and the upper stem contains leaves with digits 5-9.In addition to describing the distribution,give a reason to account for the shape of this distribution. 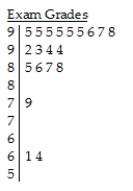
Key:
9 | 3 = 93%
A) The distribution of exam scores is skewed to the left.Typically,the student scored 94% on exams,and the exam scores are tightly clustered in the 90s.Two exam scores are outliers,when the student scored below 65%.It is possible that the student had a difficult time with one of his or her courses in that year.Regardless of the possible reasons,these two scores were unusual compared to the student's other exam scores.
B) The distribution of exam scores is skewed to the left.Typically,the student scored 95% on exams,and the exam scores are tightly clustered in the 90s.Two exam scores are outliers,when the student scored below 65%.It is possible that the student had a difficult time with one of his or her courses in that year.Regardless of the possible reasons,these two scores were unusual compared to the student's other exam scores.
C) The distribution of exam scores is skewed to the right.Typically,the student scored 95% on exams,and the exam scores are tightly clustered in the 90s.Two exam scores are outliers,when the student scored below 65%.It is possible that the student had a difficult time with one of his or her courses in that year.Regardless of the possible reasons,these two scores were unusual compared to the student's other exam scores.
D) The distribution of exam scores is skewed to the left.Typically,the student scored 95% on exams,and the exam scores are tightly clustered in the upper 80s and lower 90s.Two exam scores are outliers,when the student scored below 65%.It is possible that the student had a difficult time with one of his or her courses in that year.Regardless of the possible reasons,these two scores were unusual compared to the student's other exam scores.
E) The distribution of exam scores is skewed to the left.Typically,the student scored 95% on exams,and the exam scores are tightly clustered in the 90s.
Correct Answer:

Verified
Correct Answer:
Verified
Q8: The histogram shows the sizes (in acres)of
Q9: The weights,in kilograms,of 17 randomly selected adults
Q10: Here are the average mathematics achievement scores
Q11: A sewing supply company has a database
Q12: A business owner recorded her annual profits
Q14: Ontario wanted to find the typical size
Q15: The number of days off that 30
Q17: Three statistics classes (50 students each)took the
Q18: Which class do you think performed better
Q109: Ages of patients who had their tonsils