Multiple Choice
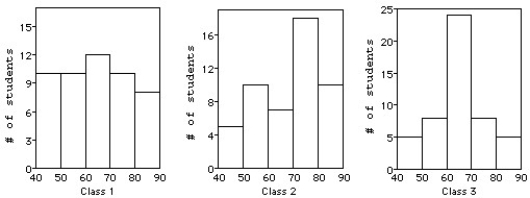
Three statistics classes (50 students each) took the same test.Shown below are histograms of the scores for the classes.Use the histograms to answer the question. 
-Which class had the smallest IQR?
A) Class 3,because the shape is symmetric and unimodal.
B) Class 3,because the shape has the highest number of students.
C) Class 2,because the shape is skewed.
D) Class 1,because the shape is fairly symmetric and uniform.
E) None,because all the classes had the same IQR.
Correct Answer:

Verified
Correct Answer:
Verified
Q12: A business owner recorded her annual profits
Q13: A student at a local university took
Q14: Ontario wanted to find the typical size
Q15: The number of days off that 30
Q18: Which class do you think performed better
Q19: A new business had the following monthly
Q20: Here is the stem-and-leaf display of the
Q21: The test scores of 19 students are
Q22: The semester point totals of 16 students
Q109: Ages of patients who had their tonsils