Multiple Choice
The mathematics department at a Canadian university collected data for the number of students enrolled in 40 math courses over the course of one year.The following stem-and-leaf display shows the total number of students enrolled in each class. 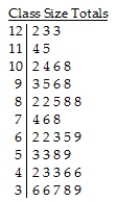
Key:
10 | 6 = 106 students
A) The distribution of the number of students enrolled in each of 40 math courses is skewed to the left,with a typical class size of 89 students.The smallest class size was 36 and the largest was 123.
B) The distribution of the number of students enrolled in each of 40 math courses is unimodal and symmetric.The smallest class size was 36 and the largest was 123.The centre of the distribution was around 75 students.
C) The distribution of the number of students enrolled in each of 40 math courses is nearly uniform.The smallest class size was 36 and the largest was 123.The centre of the distribution was around 89 students.
D) The distribution of the number of students enrolled in each of 40 math courses is nearly uniform.The smallest class size was 36 and the largest was 123.The centre of the distribution was around 75 students.
E) The distribution of the number of students enrolled in each of 40 math courses is skewed to the right,with a typical class size of 69 students.The smallest class size was 36 and the largest was 123.
Correct Answer:

Verified
Correct Answer:
Verified
Q23: Office workers were asked how long it
Q24: Which set has the largest standard deviation?
Q25: A university instructor created a website for
Q26: A substitute teacher traveled the following distances,in
Q27: Here are the grocery bills,in dollars,for six
Q29: Three statistics classes (50 students each)took the
Q31: A dotplot of the number of tornadoes
Q32: The weights (in kilograms)of 27 dogs are
Q33: The histogram displays the body fat percentages
Q57: Number of times each face of a