Multiple Choice
A dotplot of the number of tornadoes each year in a certain county from 1948 to 2004 is given.Each dot represents a year in which there were that many tornadoes. 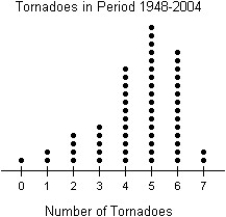
A) The distribution of the number of tornadoes per year is unimodal and symmetric,with a centre around 5 tornadoes per year.The number of tornadoes per year ranges from 0 to 7.
B) The distribution of the number of tornadoes per year is unimodal and skewed to the left,with a centre around 3.5 tornadoes per year.The number of tornadoes per year ranges from 0 to 7.
C) The distribution of the number of tornadoes per year is unimodal and symmetric,with a centre around 3.5 tornadoes per year.The number of tornadoes per year ranges from 0 to 7.
D) The distribution of the number of tornadoes per year is unimodal and skewed to the left,with a centre around 5 tornadoes per year.The number of tornadoes per year ranges from 0 to 7.
E) The distribution of the number of tornadoes per year is unimodal and skewed to the right,with a centre around 5 tornadoes per year.The number of tornadoes per year ranges from 0 to 7.
Correct Answer:

Verified
Correct Answer:
Verified
Q26: A substitute teacher traveled the following distances,in
Q27: Here are the grocery bills,in dollars,for six
Q28: The mathematics department at a Canadian university
Q29: Three statistics classes (50 students each)took the
Q32: The weights (in kilograms)of 27 dogs are
Q33: The histogram displays the body fat percentages
Q34: Which set has the largest standard deviation?
Q35: For class 2,compare the mean and the
Q36: Three statistics classes (50 students each)took the
Q57: Number of times each face of a