Multiple Choice
Shown below are the boxplot and the histogram for the weights (in pounds) of 30 newborn babies in the U.S.A.. 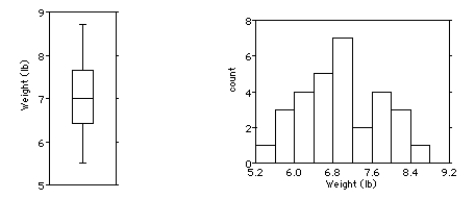
i.What features of the distribution can you see in both the histogram and the boxplot?
ii.What features of the distribution can you see in the histogram that you could not see in the boxplot?
A) i) The distribution is bimodal and symmetric.There are two outliers at about 5.4 and 8.6.The mean and median values are about the same.
ii.The dip at about 7.4 lb,for example,is apparent only from the histogram.
B) i) The distribution is unimodal and skewed to the right.There are no outliers.The mean is greater than the median.
ii.The dip at about 7.4 lb,for example,is apparent only from the histogram.
C) i) The distribution is unimodal and symmetric.There are two outliers at about 5.4 and 8.6.The mean and median values are about the same.
ii.The dip at about 7.4 lb,for example,is apparent only from the histogram.
D) i) The distribution is unimodal and skewed to the left.There are no outliers.The mean is less than the median.
ii.The dip at about 7.4 lb,for example,is apparent only from the histogram.
E) i) The distribution is unimodal and symmetric.There are no outliers.The mean and median values are about the same.
ii.The dip at about 7.4 lb,for example,is apparent only from the histogram.
Correct Answer:

Verified
Correct Answer:
Verified
Q46: The test scores of 15 students are
Q47: Here is a histogram of the assets
Q48: The back-to-back stem-and-leaf display compares the annual
Q49: In May 2011,17 coffee shops in Vancouver
Q50: The times,in minutes,it took for 21 students
Q52: Do men and women run a 5-kilometre
Q53: The Ontario Ministry of Education collects data
Q54: Here are the average mathematics achievement scores
Q55: Here are some statistics for the annual
Q56: The test scores of 40 students are