The Back-To-Back Stem-And-Leaf Display Compares the Annual Precipitation,in Millimetres,of of Two
Multiple Choice
The back-to-back stem-and-leaf display compares the annual precipitation,in millimetres,of of two towns over a period of 14 years.The lower stem contains leaves with the digits 0-4 and the upper stem contains leaves with digits 5-9. 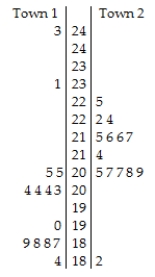
Key:
20 | 7 = 20.7 millimetres
A) The distribution of annual precipitation in Town 1 is bimodal,with one cluster centred around the mid 20s and another cluster in the high 18s.There are two high outliers of 23.1 and 24.3 mm for Town 1.In Town 2,the distribution of annual precipitation is unimodal and skewed right,clustered predominantly between 20.5 and 22.4.There is a low outlier of 18.2 mm for Town 2.The annual precipitation is generally higher and more sporadic in Town 1.
B) The distribution of annual precipitation in Town 1 is bimodal,with one cluster centred around the mid 20s and another cluster in the high 18s.There are two high outliers of 23.1 and 24.3 mm for Town 1.In Town 2,the distribution of annual precipitation is unimodal and skewed right,clustered predominantly between 20.5 and 22.4.There is a low outlier of 18.2 mm for Town 2.The annual precipitation is more consistent in Town 2;but overall,both cities have the same average annual precipitation.
C) The distribution of annual precipitation in Town 1 is bimodal,with one cluster centred around the mid 20s and another cluster in the high 18s.There are two high outliers of 23.1 and 24.3 mm for Town 1.In Town 2,the distribution of annual precipitation is unimodal and skewed left,clustered predominantly between 20.5 and 22.4.There is a low outlier of 18.2 mm for Town 2.The annual precipitation is generally higher and more consistent in Town 2.
D) The distribution of annual precipitation in Town 1 is bimodal,with one cluster centred around the mid 20s and another cluster in the high 18s.In Town 2,the distribution of annual precipitation is unimodal and skewed right,clustered predominantly between 20.5 and 22.4.The annual precipitation is generally higher and more consistent in Town 2.
E) The distribution of annual precipitation in Town 1 is bimodal,with one cluster centred around the mid 20s and another cluster in the high 18s.There are two high outliers of 23.1 and 24.3 mm for Town 1.In Town 2,the distribution of annual precipitation is unimodal and skewed right,clustered predominantly between 20.5 and 22.4.There is a low outlier of 18.2 mm for Town 2.The annual precipitation is generally higher and more consistent in Town 2.
Correct Answer:

Verified
Correct Answer:
Verified
Q43: The ages of the 21 members of
Q44: Here is the stem-and-leaf display of the
Q45: A business owner recorded her annual profits
Q46: The test scores of 15 students are
Q47: Here is a histogram of the assets
Q49: In May 2011,17 coffee shops in Vancouver
Q50: The times,in minutes,it took for 21 students
Q51: Shown below are the boxplot and the
Q52: Do men and women run a 5-kilometre
Q53: The Ontario Ministry of Education collects data