Multiple Choice
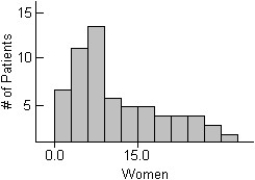
The centre for health in a certain country compiles data on the length of stay by patients in short-term hospitals and publishes its statistical findings annually.Data from a sample of 67 male patients and 63 female patients on length of stay (in days) are displayed in the histograms below. 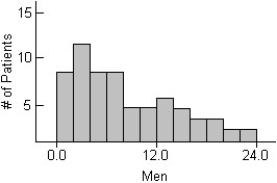
i) What would you suggest be changed about these histograms to make them easier to compare?
ii) Describe these distributions by writing a few sentences comparing the duration of hospitalization for men and women.
Iii) Can you suggest a reason for the peak in women's length of stay?
A) i) They should be put on the same scale,from 0 to 40 days.
Ii) Men have a mode near 1 day,then tapering off from there.Women have a mode near 6 days with a sharp drop afterward.
Iii) A possible reason is childbirth.
B) i) They should be put on the same scale,from 0 to 33 days.
Ii) Men have a mode near 3 days,then tapering off from there.Women have a mode near 8 days with a sharp drop afterward.
Iii) A possible reason is childbirth.
C) i) They should be put on the same scale,from 0 to 25 days.
Ii) Men have a mode near 2 days,then tapering off from there.Women have a mode near 4 days with a sharp drop afterward.
Iii) A possible reason is childbirth.
D) i) They should be put on the same scale,from 0 to 15 days.
Ii) Men have a mode near 3 days,then tapering off from there.Women have a mode near 10 days with a sharp drop afterward.
Iii) A possible reason is childbirth.
E) i) They should be put on the same scale,from 0 to 18 days.
Ii) Men have a mode near 7 days,then tapering off from there.Women have a mode near 1 day with a sharp drop afterward.
Iii) A possible reason is childbirth.
Correct Answer:

Verified
Correct Answer:
Verified
Q29: How would you describe the shape of
Q54: Here are the average mathematics achievement scores
Q55: Here are some statistics for the annual
Q56: The test scores of 40 students are
Q57: A medical study of the effects of
Q58: Here are the average mathematics achievement scores
Q60: The weekly salaries (in dollars)of sixteen government
Q62: Here is the stem-and-leaf display of the
Q63: Match each class with the corresponding boxplot
Q64: Here are summary statistics for the time,in