Multiple Choice
Here is the stem-and-leaf display of the midterm test scores for the seventh-period mathematics class.
Midterm Test Scores 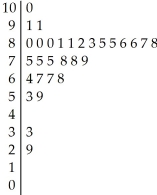
Key:
7 | 5 = 75 points
A) The distribution of the midterm test scores is unimodal and skewed to the left.The median is 80 with an IQR of 17 (Q1 is 68 and Q3 is 85) .The first score is an outlier.
B) The distribution of the midterm test scores is unimodal and skewed to the left.The median is 80 with an IQR of 17 (Q1 is 68 and Q3 is 85) .The first two scores are outliers.
C) The distribution of the midterm test scores is unimodal and skewed to the left.The median is 79 with an IQR of 17 (Q1 is 68 and Q3 is 85) .The first two scores are outliers.
D) The distribution of the midterm test scores is unimodal and skewed to the left.The median is 80 with an IQR of 17 (Q1 is 68 and Q3 is 85) .There are no outliers.
E) The distribution of the midterm test scores is unimodal and skewed to the right.The median is 80 with an IQR of 17 (Q1 is 68 and Q3 is 85) .The first two scores are outliers.
Correct Answer:

Verified
Correct Answer:
Verified
Q29: How would you describe the shape of
Q57: A medical study of the effects of
Q58: Here are the average mathematics achievement scores
Q59: The centre for health in a certain
Q60: The weekly salaries (in dollars)of sixteen government
Q63: Match each class with the corresponding boxplot
Q64: Here are summary statistics for the time,in
Q65: The weights (in kilograms)of 27 dogs are
Q66: Here are the summary statistics for mathematics
Q67: Shown below are the data and summary