Multiple Choice
Here are the summary statistics for mathematics scores for one high school graduating class,and the parallel boxplots comparing the scores of male and female students.Write a brief report on these results.Be sure to discuss shape,centre,and spread of the scores. 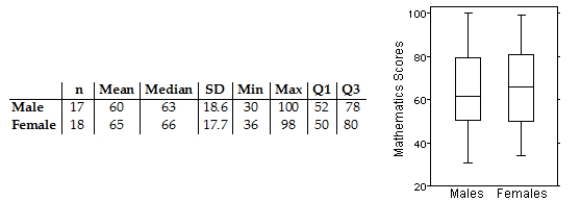
A) Median score by females at 66 points is 3 points higher than that by males,and female mean is higher by 5.The middle 50% for both group is close with a IQR at 26 for the males and 30 for the females.The males have a larger range from 30 to 100.The distribution is right-skewed for the females and symmetric for the males.
B) Median score by females at 66 points is 3 points higher than that by males,and female mean is higher by 5.The middle 50% for both group is close with a IQR at 26 for the males and 30 for the females.The males have a larger range from 30 to 100.Both distributions are right-skewed.
C) Median score by females at 66 points is 3 points higher than that by males,and female mean is higher by 5.The middle 50% for both group is close with a IQR at 26 for the males and 30 for the females.The males have a larger range from 30 to 100.The distribution is right-skewed for the males and symmetric for the females.
D) Median score by females at 66 points is 3 points higher than that by males,and male mean is higher by 5.The middle 50% for both group is close with a IQR at 30 for the males and 26 for the females.The males have a larger range from 30 to 100.The distribution is right-skewed for the males and symmetric for the females.
E) Median score by females at 66 points is 3 points higher than that by males,and female mean is higher by 5.The middle 50% for both group is close with a IQR at 26 for the males and 30 for the females.The males have a smaller range from 30 to 100.Both distributions are left-skewed.
Correct Answer:

Verified
Correct Answer:
Verified
Q46: Which class had the highest median score?<br>A)Class
Q67: Shown below are the data and summary
Q68: In a child psychology course,children took part
Q69: Here are boxplots of the points scored
Q70: The normal annual precipitation (in millimetres)is given
Q71: Office workers were asked how long it
Q73: The heights,in centimetres,of 18 randomly selected Grade
Q74: Here are the test scores of 32
Q75: Here are the heights,in centimetres,of 32 Grade
Q76: The frequency table shows the weight ,in