Multiple Choice
Shown below are the data and summary statistics for the reading scores of 29 fifth graders. 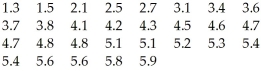

Write a brief summary of the performance of the fifth graders.
A) The distribution is unimodal and skewed to the left.The median is 4.6,while the mean is 4.2,lower than the median score.The middle 50% of the weekly salaries are between 3.6 and 5.2,for an IQR of 1.6.There are no outliers.
B) The distribution is unimodal and skewed to the right.The median is 4.6,while the mean is 4.2,lower than the median score.The middle 50% of the weekly salaries are between 3.6 and 5.2,for an IQR of 1.6.There are no outliers.
C) The distribution is unimodal and skewed to the left.The median is 4.6,while the mean is 4.2,lower than the median score.The middle 50% of the weekly salaries are between 3.6 and 5.2,for an IQR of 1.6.The score of 1.3 is an outlier.
D) The distribution is skewed to the right.The median is 4.2,while the mean is 4.6,higher than the median score.The middle 50% of the weekly salaries are between 3.6 and 5.2,for an IQR of 1.6.There are no outliers.
E) The distribution is unimodal and skewed to the left.The median is 4.2,while the mean is 4.6,higher than the median score.The middle 50% of the weekly salaries are between 3.6 and 5.2,for an IQR of 1.6.There are no outliers.
Correct Answer:

Verified
Correct Answer:
Verified
Q62: Here is the stem-and-leaf display of the
Q63: Match each class with the corresponding boxplot
Q64: Here are summary statistics for the time,in
Q65: The weights (in kilograms)of 27 dogs are
Q66: Here are the summary statistics for mathematics
Q68: In a child psychology course,children took part
Q69: Here are boxplots of the points scored
Q70: The normal annual precipitation (in millimetres)is given
Q71: Office workers were asked how long it
Q72: Here are the summary statistics for mathematics