Multiple Choice
Shown below are the boxplot and summary statistics for the heights,in centimetres,of a class of Grade 3 students in Halifax,NS. 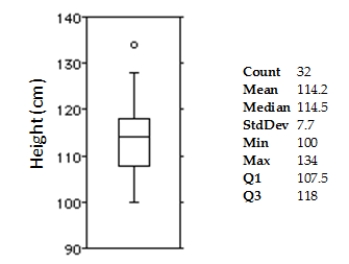
Which measures of centre and spread would you use for this distribution?
A) Median and standard deviation,because the outlier affects the mean.
B) Mean and standard deviation,because the outlier affects the mean.
C) Mean and IQR,because the outlier does not really affect the mean.
D) Median and IQR,because the outlier significantly affects the mean.
E) Mean and standard deviation,because the outlier does not really affect the mean.
Correct Answer:

Verified
Correct Answer:
Verified
Q10: A local ice cream shop hand scoops
Q33: The normal monthly precipitation (in inches)for August
Q34: Here are 3 boxplots of weekly gas
Q35: Here are boxplots of the points scored
Q36: The weekly salaries (in dollars)of 24 randomly
Q37: Use the high closing values of Naristar
Q40: A student at a local university took
Q41: Shown below are the boxplot,the histogram and
Q42: The boxplots display case prices (in dollars)of
Q43: The ages of the 21 members of