Multiple Choice
Here are 3 boxplots of weekly gas prices at a service station in the U.S.A.(price in $ per gallon) .Compare the distribution of prices over the three years. 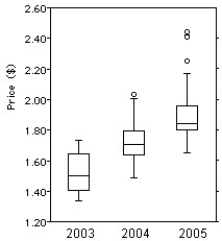
A) Gas price have been increasing on average over the 3-year period,but the spread has been decreasing.The distribution has been skewed to the left,and there were 3 high outliers in 2005.
B) Gas price have been increasing on average over the 3-year period,and the spread has been increasing as well.The distribution has been skewed to the right,and there were 3 high outliers in 2005.
C) Gas price have been decreasing on average over the 3-year period,and the spread has been decreasing.The distribution has been skewed to the left,and there were 3 high outliers in 2005.
D) Gas price have been decreasing on average over the 3-year period,but the spread has been increasing.The distribution has been skewed to the right,and there were 3 high outliers in 2005.
E) Gas price have been increasing on average over the 3-year period,and the spread has been increasing as well.The distribution has been skewed to the left,and there were 3 high outliers in 2005.
Correct Answer:

Verified
Correct Answer:
Verified
Q10: A local ice cream shop hand scoops
Q29: Use the high closing values of Naristar
Q30: Shown below are the boxplot,the histogram and
Q31: Shown below are the boxplot and the
Q32: Here are summary statistics for the time,in
Q33: The normal monthly precipitation (in inches)for August
Q35: Here are boxplots of the points scored
Q36: The weekly salaries (in dollars)of 24 randomly
Q37: Use the high closing values of Naristar
Q38: Shown below are the boxplot and summary