Multiple Choice
Here is an ogive of the distribution of students' marks on their statistics test. 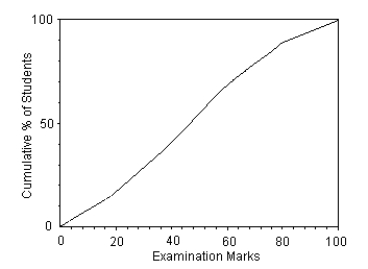
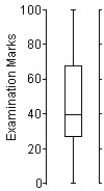
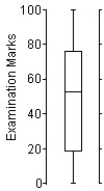
Choose the boxplot that represents the given data.
I II III 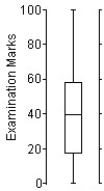
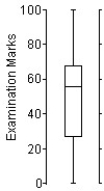
IV V 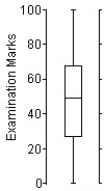
A) I
B) II
C) III
D) IV
E) V
Correct Answer:

Verified
Correct Answer:
Verified
Related Questions
Q4: Which class do you think performed better
Q17: Which class had the largest standard deviation?<br>A)Class
Q27: Which class had the smallest IQR?<br>A)Class 1,because
Q37: A small company employs a supervisor at
Q94: The histograms display the body fat percentages
Q99: Here is a histogram of the assets
Q100: Here is the boxplot and an ogive
Q101: Describe what these boxplots tell you about
Q102: A class of sixth graders takes a
Q108: The free throw percentages for participants in