Multiple Choice
Here is the boxplot and an ogive of the distribution of students marks on their statistics test. 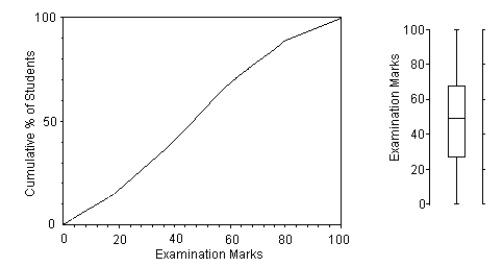
Write a few sentences describing this distribution.
A) The distribution of the marks is slightly skewed to the left.The median mark was about 48,with a max of 100 and a min of 0.The middle 50% of the marks appeared to range from 18 to 75,for an IQR of 57.55% of the students had a mark less than 50.
B) The distribution of the marks is slightly skewed to the left.The median mark was about 48,with a max of 100 and a min of 0.The middle 50% of the marks appeared to range from 26 to 66,for an IQR of 40.About 55% of the students had a mark less than 50.
C) The distribution of the marks is slightly skewed to the right.The median mark was about 48,with a max of 100 and a min of 0.The middle 50% of the marks appeared to range from 26 to 66,for an IQR of 40.About 55% of the students had a mark greater than 50.
D) The distribution of the marks is slightly skewed to the left.The median mark was about 48,with a max of 100 and a min of 0.The middle 50% of the marks appeared to range from 26 to 66,for an IQR of 40.About 55% of the students had a mark greater than 50.
E) The distribution of the marks is slightly skewed to the right.The median mark was about 55,with a max of 100 and a min of 0.The middle 50% of the marks appeared to range from 26 to 66,for an IQR of 40.About 55% of the students had a mark less than 50.
Correct Answer:

Verified
Correct Answer:
Verified
Q4: Which class do you think performed better
Q17: Which class had the largest standard deviation?<br>A)Class
Q27: Which class had the smallest IQR?<br>A)Class 1,because
Q37: A small company employs a supervisor at
Q94: The histograms display the body fat percentages
Q98: Here is an ogive of the distribution
Q99: Here is a histogram of the assets
Q101: Describe what these boxplots tell you about
Q102: A class of sixth graders takes a
Q108: The free throw percentages for participants in