Multiple Choice
A survey was conducted in 20 counties to determine the percentage of teenagers who had used marijuana and other drugs.Data shown on the following scatterplot indicate a correlation of 0.972 between the percent of teens who have used marijuana and the percent who have used other drugs.Describe the association. 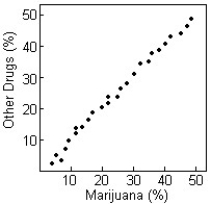
A) Strong curved relation in a positive direction
B) Weak linear relation in a positive direction
C) Strong linear relation in a positive direction
D) Strong nonlinear relation in a positive direction
E) No evidence of relation
Correct Answer:

Verified
Correct Answer:
Verified
Q7: An economist noticed that nations with more
Q24: A teacher studied students' grades and established
Q47: Adam would like to buy a used
Q64: To get the best deal on a
Q65: A reporter investigates speeding on roads in
Q66: Data collected from 20 students in Statistics
Q69: Several scatterplots are given with calculated correlations.
Q71: Determine whether the scatterplot shows little or
Q72: Several scatterplots are given with calculated correlations.
Q73: Two different tests are designed to measure