Essay
The table below displays data showing weight gain,in grams,for nine young rats,three from each of three litters.Three different diets (the treatments)were assigned at random to the three siblings in litter one (block 1).This was repeated for the other two litters (blocks 2 and 3). 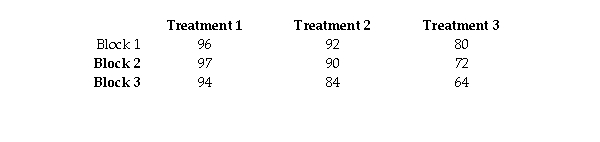
Conduct a Friedman test at the 0.05 level of significance to determine if there are differences between the three diets.
Correct Answer:

Verified
Correct Answer:
Verified
Q1: The paired data below consist of the
Q2: Below are bacteria count for three different
Q4: SAT scores for students selected randomly from
Q5: A coach uses a new technique in
Q6: Below are bacteria count for four different
Q7: Consider the following data from an experiment
Q8: The table below shows the weights of
Q9: A person who commutes to work is
Q10: A group of persons filled in a
Q11: The table below displays data showing weight