Multiple Choice
The phase diagram of a substance is shown below. 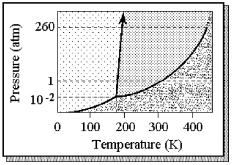
-The approximate normal boiling point of this substance is
A) 180 K.
B) 190 K.
C) 300 K.
D) 430 K.
Correct Answer:

Verified
Correct Answer:
Verified
Related Questions
Q114: Rubber is classified as an _ solid,whereas
Q115: Iron crystallizes in a body-centered cubic cell
Q116: The critical temperature of a substance is
Q117: Bromine is one of only two elements
Q118: An ionic compound crystallizes in a unit
Q120: The plots below represent vapor pressure vs.temperature
Q121: <img src="https://d2lvgg3v3hfg70.cloudfront.net/TB4940/.jpg" alt=" -If figure (1)represents
Q122: What is the edge length of a
Q123: The vapor pressure of a pure liquid
Q124: A certain mineral,M<sub>x</sub>M'<sub>y</sub>A<sub>z</sub>,crystallizes in the cubic unit