Multiple Choice
The following diagram shows a close-up view of the vapor pressure curves for two pure liquids and two different solutions composed of these two liquids.Which curves represent pure liquids and which curves represent the solutions? 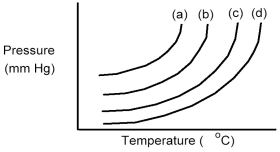
A) Curves (a) and (b) are the pure liquids and curves (c) and (d) are the solutions.
B) Curves (a) and (c) are the pure liquids and curves (b) and (d) are the solutions.
C) Curves (a) and (d) are the pure liquids and curves (b) and (c) are the solutions.
D) Curves (c) and (d) are the pure liquids and curves (a) and (b) are the solutions.
Correct Answer:

Verified
Correct Answer:
Verified
Q187: What is the weight percent of vitamin
Q188: What is the weight percent of vitamin
Q189: A solution of 62.4 g of insulin
Q190: What is the freezing point of a
Q191: Assuming that sea water is a 3.5
Q193: Drawing (1)shows a system in which an
Q194: A solution is 4.50% by weight NaHCO<sub>3</sub>.How
Q195: Which of the following aqueous salt (NaCl)solutions
Q196: When 0.500 g of vitamin K is
Q197: Chloroform has a boiling point of 61.1°C