Multiple Choice
The following plot shows two titration curves,each representing the titration of 50.00 mL of 0.100 M acid with 0.100 M NaOH. 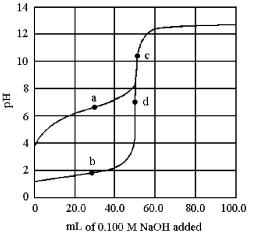
-Which point a-d represents a buffer region?
A) point a
B) point b
C) point c
D) point d
Correct Answer:

Verified
Correct Answer:
Verified
Related Questions
Q47: What is the pH of a solution
Q48: In which of the following solutions would
Q49: Which is a net ionic equation for
Q50: Use the graphs below to answer the
Q51: The following pictures represent solutions of AgCl,which
Q53: At what pH is the amino acid
Q54: The following pictures represent solutions of CuS,which
Q55: Addition of 0.0125 mol HCl to 150
Q56: What is the pH at the equivalence
Q57: Formic acid (HCO<sub>2</sub>H,K<sub>a</sub> = 1.8 × 10<sup>-4</sup>)is