menu-iconExamlexExamLexServices

Discover

Ask a Question
  1. All Topics
  2. Topic
    Chemistry
  3. Study Set
    Chemistry Study Set 4
  4. Exam
    Exam 16: Applications of Aqueous Equilibria
  5. Question
    The Following Plot Shows a Titration Curve for the Titration
Solved

The Following Plot Shows a Titration Curve for the Titration

Question 70

Question 70

Multiple Choice

The following plot shows a titration curve for the titration of 1.00 L of 1.00 M diprotic acid H2A with NaOH. The following plot shows a titration curve for the titration of 1.00 L of 1.00 M diprotic acid H<sub>2</sub>A with NaOH.   -Which point a-d represents the HX<sup>-</sup>/X2<sup>-</sup> buffer region? A) point a B) point b C) point c D) point d
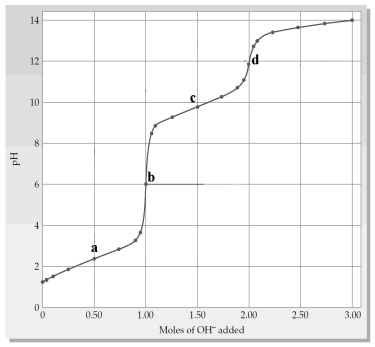
-Which point a-d represents the HX-/X2- buffer region?


A) point a
B) point b
C) point c
D) point d

Correct Answer:

verifed

Verified

Unlock this answer now
Get Access to more Verified Answers free of charge

Related Questions

Q65: What is the equilibrium constant expression for

Q66: Use the graphs below to answer the

Q67: Consider a buffered solution consisting of H<sub>2</sub>CO<sub>3</sub>

Q68: What is the molar solubility of Mg(OH)<sub>2</sub>

Q69: Oxalic acid,H<sub>2</sub>C<sub>2</sub>O<sub>4</sub> has acid dissociation constants K<sub>a1</sub>

Q71: CaF<sub>2</sub> has K<sub>sp</sub> = 3.5 × 10<sup>-11</sup>.If

Q72: When 70 mL of 0.18 M NH<sub>4</sub>Cl

Q73: The following pictures represent solutions at various

Q74: What is the most soluble salt of

Q75: The following pictures represent solutions that contain

Examlex

ExamLex

About UsContact UsPerks CenterHomeschoolingTest Prep

Work With Us

Campus RepresentativeInfluencers

Links

FaqPricingChrome Extension

Download The App

Get App StoreGet Google Play

Policies

Privacy PolicyTerms of ServiceHonor CodeCommunity Guidelines

Scan To Download

qr-code

Copyright © (2025) ExamLex LLC.

Privacy PolicyTerms Of ServiceHonor CodeCommunity Guidelines