Multiple Choice
The figure shows an energy level diagram for the hydrogen atom. Several transitions are shown and are labeled by letters. 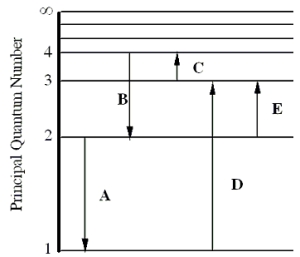 Note: The diagram is not drawn to scale.
-Which transition involves the longest wavelength line in the visible portion of the hydrogen spectrum?
A) A
B) B
C) C
D) D
E) E
Correct Answer:

Verified
Correct Answer:
Verified
Q64: The figure shows an energy level diagram
Q65: What energy (in eV) is required to
Q66: A neutral atom has the following electronic
Q67: Consider the following list of electron configurations:
Q68: According to the quantum mechanical picture of
Q69: The figure shows an energy level diagram
Q71: What is the operating voltage of a
Q72: Which one of the following factors best
Q73: Electrons have been removed from a lithium
Q74: The figure shows an energy level diagram